Trading Journal With Chart Screenshots: Weekly Review System That Fixes Repeat Mistakes

You already know you should journal.
You downloaded the spreadsheet. You filled in three days. Then the market got volatile, you took a revenge trade, and the journal became a graveyard of empty rows.
That is not a discipline problem. It is a system problem.
Most trading journal templates are built for accountants, not for traders who think in charts. They ask for P and L columns when what you actually need is a visual record of what you saw, what you planned, and what you did anyway.
This guide gives you a trading journal template built around chart screenshots, a five-minute daily log habit, and a Sunday weekly review that surfaces repeat mistakes before they become account damage.
Who this is for
This system fits you if:
- You trade from TradingView, your broker platform, or similar charting tools.
- You keep telling yourself "I need to journal" but never stick with it.
- You notice the same mistakes every month (early entries, moving stops, overtrading chop) but cannot pin down when they start.
- You want trading psychology improvements backed by data you can see, not vague self-talk.
If you want a tax spreadsheet for the IRS, use Excel. If you want to stop bleeding the same way twice, use screenshots.
Why spreadsheets fail traders
Spreadsheets fail for three predictable reasons.
They separate the chart from the decision. You type "long ES breakout" in a cell. Six weeks later you have no idea what the chart looked like, what timeframe you used, or why that breakout felt obvious. The context evaporates. Without context, review is guesswork.
They reward the wrong metrics early. New traders obsess over win rate columns and green/red formatting. That encourages hiding losses, skipping entries, or journaling only winning days. A journal that makes you feel good is not a journal. It is a diary.
They are too heavy for a tired brain. After a red day, opening a 14-tab workbook and filling 22 fields is not happening. The best trading journal template is the one you actually use on your worst day, not your best.
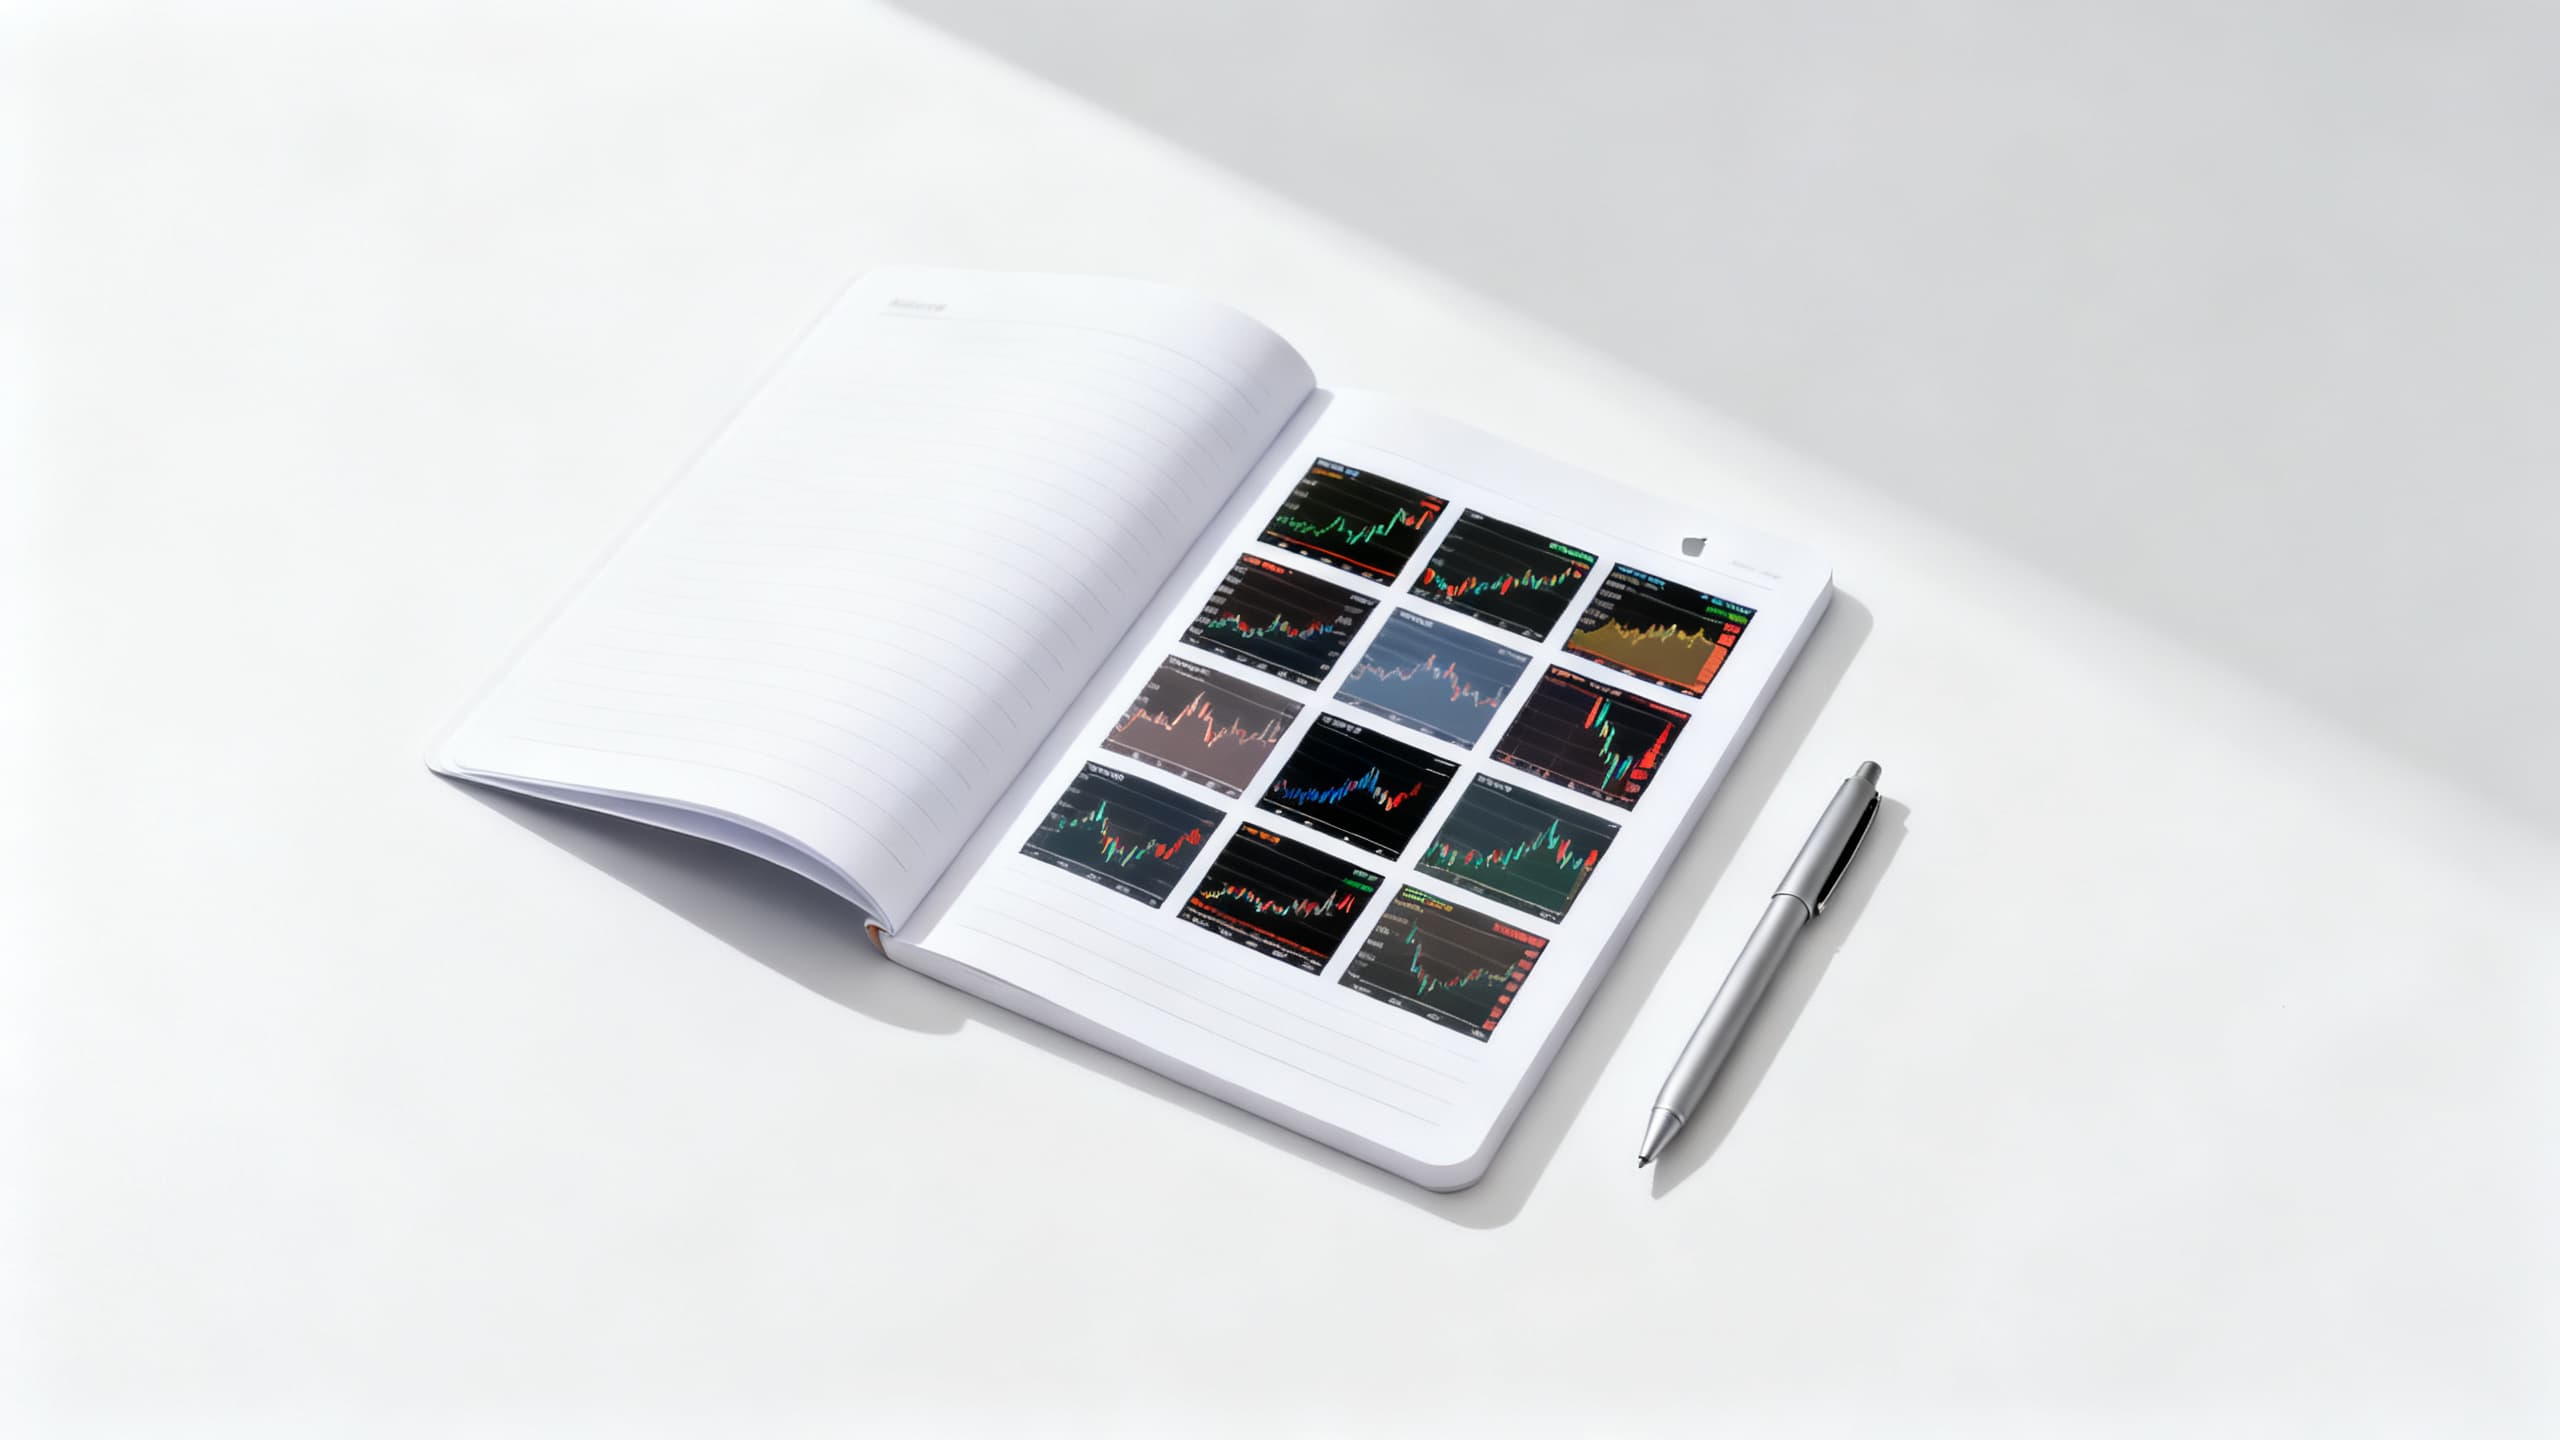
Chart screenshots fix the first problem instantly. A single image holds structure, indicators, session timing, and the emotional state of the market in one frame. Pair that with a short text log and you have evidence, not memory.
Minimum fields for every journal entry
You do not need 50 columns. You need eight fields that force honesty.
Copy this block into Notion, Obsidian, Google Docs, or a simple folder structure. Same template every time.
Date and session:
Symbol and timeframe:
Setup tag (one label only):
Screenshot file name:

Plan before entry:
  Bias (long / short / wait):
  Entry trigger:
  Stop:
  Target(s):

Actual execution:
  Did you follow the plan? (Y / partial / no):
  Exit reason:
  Result in R (not just dollars):

One sentence: what would you repeat or skip?
That is your core trading journal template. Everything else is optional.
Why R instead of dollars? R normalizes across position sizes and symbols. A -1R day on a small account and a -1R day on a larger account teach the same lesson: you lost one planned unit of risk. Dollars lie when you size emotionally.
Why one setup tag? Because pattern spotting later depends on clean categories. "Kind of a breakout maybe" is useless in review. "Breakout retest long" is actionable.
If you already use structured plans from tools like Quant.AX, paste the generated entry, stop, and target block into the plan section. The screenshot plus the written plan is your audit trail.
Screenshot rules that make review honest
Bad screenshots ruin good journals. Follow these rules so future-you can actually learn.
Capture before entry, not after. The pre-trade screenshot is the truth. The post-trade screenshot is storytelling. You will crop, zoom, and unconsciously highlight the move that just happened. Always save the chart as it looked when you decided to click.
Include symbol and timeframe in the frame. Crop so the ticker and interval are visible. If your platform hides them, write them on the image or in the file name: 2026-02-17_ES_5m_pre.jpg.
One screenshot per decision. Do not dump ten charts into one entry without labels. If you use multiple timeframes, save them as a set: ES_1H_context.jpg and ES_5m_entry.jpg.
Mark your plan on the chart lightly. Horizontal lines for entry, stop, and target are enough. Heavy drawings obscure structure and make AI-assisted review harder later.
Store files in date order. Folder structure beats fancy software: Journal / 2026 / 02-February / 2026-02-17 /. Future you will thank present you.
These rules align with how structured chart analysis works. If you want a deeper workflow for turning screenshots into entries, stops, and targets, read our guide on how to analyze a trading chart screenshot with AI.
The daily log habit (five minutes, no excuses)
The daily log is not a novel. It is a deposit into Sunday's review.
When: Within 30 minutes of your last trade, or at session close. Same time every day beats perfect timing once a week.
How long: Five minutes. Set a timer. If you cannot finish in five minutes, your template is too big.
What to write:
- Fill the eight minimum fields.
- Attach the pre-trade screenshot.
- Write the one-sentence lesson while the trade is still fresh.
The one sentence rule: Force a binary takeaway. "Repeat the wait for 15m confirmation" or "Skip first 15 minutes after open on Mondays." Vague lines like "need to be more patient" do not change behavior.
Bad day protocol: On revenge-trade days, log anyway. Mark the entry "plan violated" in bold. That row is often the most valuable row of the week. Skipping it trains you to hide from the journal exactly when you need it most.
Consistency beats completeness. A thin daily log every day beats a perfect weekly essay you never write.
Sunday weekly review: the system that fixes repeat mistakes
Daily logs capture events. Weekly review captures patterns. This is where your trading journal template pays off.
Block 45 to 60 minutes every Sunday (or your weekend). Same chair, same drink, no charts open for new trades. Review only.
Step 1: Sort the week by result in R
List all trades. Total R won and lost. Notice extremes, not just net P and L.
Ask:
- How many trades were planned vs impulse?
- How many full -1R losses came from the same setup tag?
- Did green days come from one symbol or one behavior?
Step 2: Open every screenshot from losing trades
This is uncomfortable. Do it anyway.
For each loss, compare plan vs actual:
- Did you enter before your trigger?
- Did you move the stop?
- Was the stop in the wrong place to begin with?
- Did you take a setup your rules say to avoid in that environment (e.g. breakout in a range)?
Circle repeats. One repeat is noise. Three repeats is a leak.
Step 3: Open winning trades and check for bad process
Winning trades lie to you. You broke rules and got paid. That teaches the worst habits.
Flag any win where:
- Stop was too wide but luck saved you
- You sized up emotionally
- You had no written plan
Decide whether to repeat the setup or repeat the mistake. They are not the same.
Step 4: Write one rule change for next week
Not five. One.
Examples:
- "No trades in first 10 minutes unless pre-market plan says otherwise."
- "Breakout tag only when daily trend agrees."
- "Max three trades per session."
Put that rule at the top of next week's journal doc. Read it Monday pre-market.
Weekly review turns trading psychology from a feeling into a feedback loop. You are not "trying to be disciplined." You are editing behavior with evidence.
Tagging setups so patterns actually show up
If every trade is tagged differently, you cannot spot patterns. Use a fixed menu of 6 to 10 setup tags. Add a new tag only after review proves you need it.
Example menu:
- Breakout retest
- Trend pullback
- Range fade
- Opening drive
- News volatility
- Reversal (use sparingly)
- No setup / impulse (honesty tag)
One tag per trade. If two apply, pick the primary thesis. The tag answers: "What was I trying to exploit?"
After four weeks, pivot your weekly review table:
| Setup tag | Trades | Net R | Plan followed % |
|---|---|---|---|
| Breakout retest | 8 | +2.5R | 75% |
| Range fade | 6 | -4R | 40% |
That table ends arguments with yourself. Maybe you are not "bad at trading." Maybe you are bad at range fades in low-volume weeks. Stop trading them. That is a journal outcome, not a motivational poster.
Pattern spotting: from leaks to rule changes
Repeat mistakes usually fall into four buckets:
Timing leaks: early entries, chasing, trading lunch chop, holding through news you ignored.
Structure leaks: counter-trend trades, fighting higher timeframe bias, stops inside noise.
Sizing leaks: doubling after losses, max size on B setups, no daily loss cap.
Process leaks: no pre-trade screenshot, no written invalidation, changing the plan mid-trade.
During monthly review (first Sunday of the month), stack four weeks of weekly notes. Look for the same bucket appearing twice. That bucket gets next month's focus rule.
Pattern spotting is chart analysis applied to your behavior. The market shows structure on screenshots. You show structure in tags and R-multiples. Same skill, different layer.
AI-assisted review without outsourcing judgment
Manual review is non-negotiable. AI can speed the boring parts if you use it correctly.
After Sunday screenshot review, pick one or two confusing trades (usually losses where you still defend the idea). Upload the pre-trade screenshot to a structured analysis tool.
Compare:
- Did the AI identify the same trend and range boundaries you saw?
- Where did it place invalidation versus where you placed your stop?
- Did it flag scenario risk you ignored (e.g. into major resistance)?
This is not about letting AI grade your trade. It is about stress-testing your story. If your journal says "perfect pullback" but the structured read says "counter-trend into supply," you found a gap worth a rule change.
Quant.AX turns chart screenshots into documented entries, stops, targets, and scenarios using specialized subagents. Use it to draft faster during the week, then use Sunday review to judge whether you followed your own process. AI does not fix revenge trading. A visible repeat mistake on a spreadsheet does, once you stop avoiding it.
For day traders who plan before the open, pairing this journal with a pre-market trade plan checklist closes the loop: plan in the morning, log during the session, review on Sunday.
What AI review cannot do
- It cannot know you moved your stop unless you logged it.
- It cannot measure your emotional state at entry.
- It cannot replace tagging and R-tracking across dozens of trades.
Treat AI as a second opinion on structure, not a replacement for the weekly review chair.
Common journal mistakes (skip these)
Logging only P and L. You learn nothing about process. Add screenshots and plan fields.
Too many setup tags. Collapse categories until patterns emerge.
Skipping weekly review because the week was "fine". Fine weeks hide process sins that wins mask.
Rewriting history. If you violated the plan, mark it violated. Your future self is the only audience.
Chasing the perfect app. Folder plus template beats another subscription you abandon in February.
Quick checklist
Daily (5 min):
- Pre-trade screenshot saved
- Eight minimum fields filled
- One-sentence lesson written
Weekly (45 to 60 min):
- All trades sorted by R
- Losing trade screenshots reviewed (plan vs actual)
- Winning trades checked for bad process
- One rule change written for next week
Monthly:
- Setup tag table updated
- One leak bucket chosen for focus
FAQ
How is this different from a trading journal template in Excel?
Excel is fine for totals and tax records. This system adds visual context and forced plan documentation so review is about decisions, not just outcomes. Use both if you want: screenshots in folders, sums in sheets.
How many trades do I need before patterns matter?
Rough guide: 20 to 30 tagged trades for setup-level patterns, 8 to 12 sessions for timing leaks. Start reviewing weekly anyway. Early reviews train the habit even when sample size is small.
Should I journal demo and live trades separately?
Tag account type in the file name or template. Process review is the same. Emotional leaks show up faster on live. Do not hide demo revenge trades; they predict live behavior.
Can I use voice notes instead of typing?
Yes for the one-sentence lesson. Still attach the screenshot and core fields. Voice without images drifts back into spreadsheet failure mode.
Bottom line
A trading journal template works when it is lighter than the guilt you feel after breaking rules. Chart screenshots give you truth. Daily logs give you continuity. Sunday weekly review gives you pattern recognition that actually changes next week's behavior.
You do not need more motivation. You need a loop: screenshot, log, review, one rule change.
When you want structured entry, stop, and target drafts from the same screenshots you already save, try Quant.AX. Build the journal habit first. Use AI to document faster. Fix repeat mistakes on Sunday, not after the next blow-up.